A Wedge: What Is It? - Pipshunt
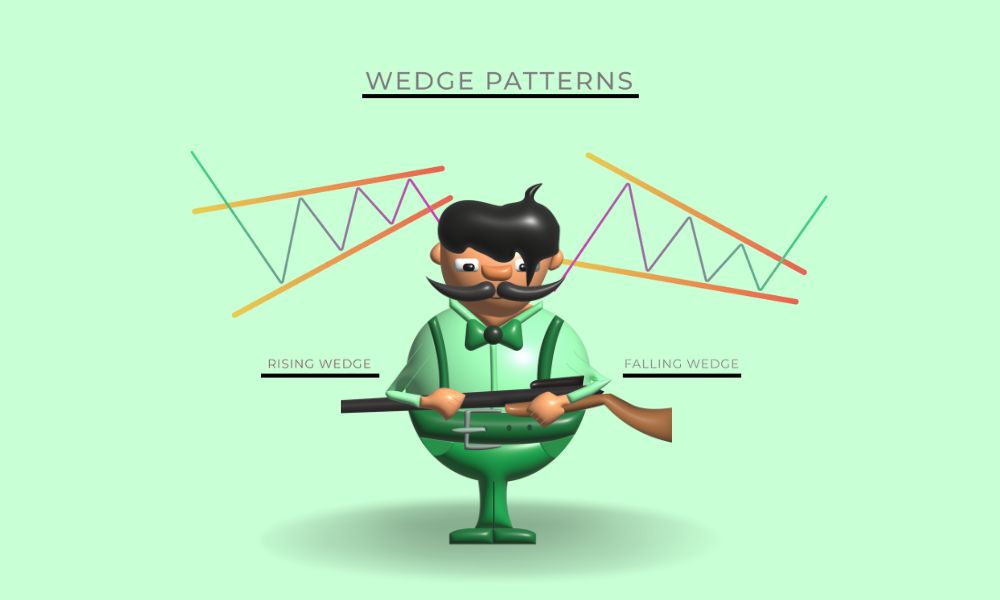
On a price chart, a wedge is a price pattern identified by converging trend lines. A price series' respective highs and lows during a period of 10 to 50 are connected by the two trend lines. The lines demonstrate that the highs and lows are either rising or falling at varying rates, which creates the impression of a wedge as the lines come together. Technical analysts view wedge-shaped trend lines as helpful signs of a likely price action reversal.
Interpret the Wedge Pattern
Any price reversal, whether bullish or bearish, can be predicted by a wedge pattern. Regardless of the situation, this pattern shares three traits: first, the convergent trend lines; second, a pattern of dropping volume as the price moves through the pattern; and third, a breakout from one of the trend lines. The wedge pattern comes in two different variations: a rising wedge (which denotes a bearish reversal) or a falling wedge (which signals a bullish reversal).
Rising Wedge
This typically happens when a security's price has been rising over time, but it can also happen when the trend is down.
A trader or analyst can predict a breakout reversal by using the trend lines drawn above and below the price chart pattern. Wedge patterns typically break in the opposite direction from the trend lines, even if price can be outside of either trend line.
Therefore, rising wedge patterns suggest that after a breach of the lower trend line, falling prices are more likely to occur. Depending on the security being tracked, traders can make bearish trades following the breakout by selling the security short or by using derivatives like futures or options. These transactions would aim to make money off the likelihood that prices will decline.
Falling wedge
A wedge pattern can form when the price of an asset has been falling over time, right before the trend's last downward movement. As buyers enter the market to halt the rate of drop and the price slide loses strength, the trend lines formed above the highs and below the lows on the price chart pattern may converge. Price may break above the upper trend line prior to the lines converging.
|
|
It is anticipated that the security would trend upward when the price breaks through the upper trend line. In order to profit from the security's price increase, traders who see bullish reversal indications should seek out trades.
On a price chart, a wedge is a price pattern identified by converging trend lines. A price series' respective highs and lows during a period of 10 to 50 are connected by the two trend lines. The lines demonstrate that the highs and lows are either rising or falling at varying rates, which creates the impression of a wedge as the lines come together. Technical analysts view wedge-shaped trend lines as helpful signs of a likely price action reversal.
